Last week we introduced a new series on our blog about reports. We kicked things off by highlighting the top five reports for teachers and are continuing the series today by sharing our most popular reports for principals or other building-level administrators. You can see last week’s post here, but we are excited to devote today’s post to the incredible school-level administrators. Just as we did in our teachers’ reports post, we wanted to start by addressing the main questions and data trends of importance to principals and other building administrators. Most commonly, these include:
- How are the students in my school performing?
- Are teachers delivering effective instruction and (positively) impacting achievement?
- How is assessment technology being used?
- What tests are being administered today, tomorrow, next week, etc.?
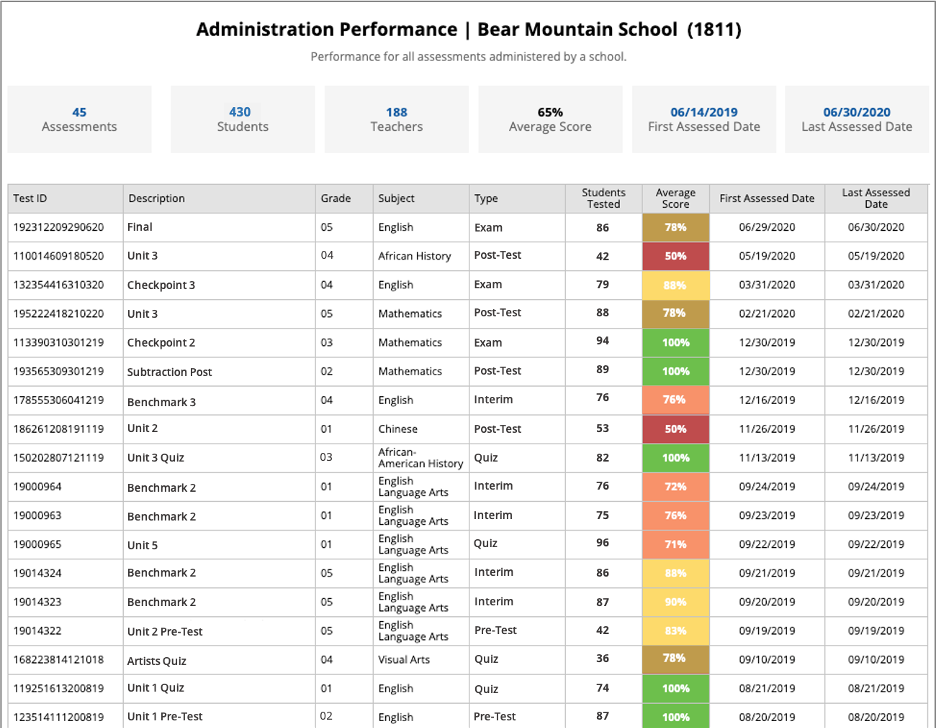
#1: Administration Performance
To answer the last question, the Administration Performance report is particularly useful. It addresses questions such as “who is testing right now,” “what tests are being taken right now,” and “how are students performing on tests.” The Administration Performance report gives users a high level, quickly accessible grid of assessment scores and various data points so they can keep track of ongoing testing. It includes the assessment, students tested, average score and first and last assessment date.
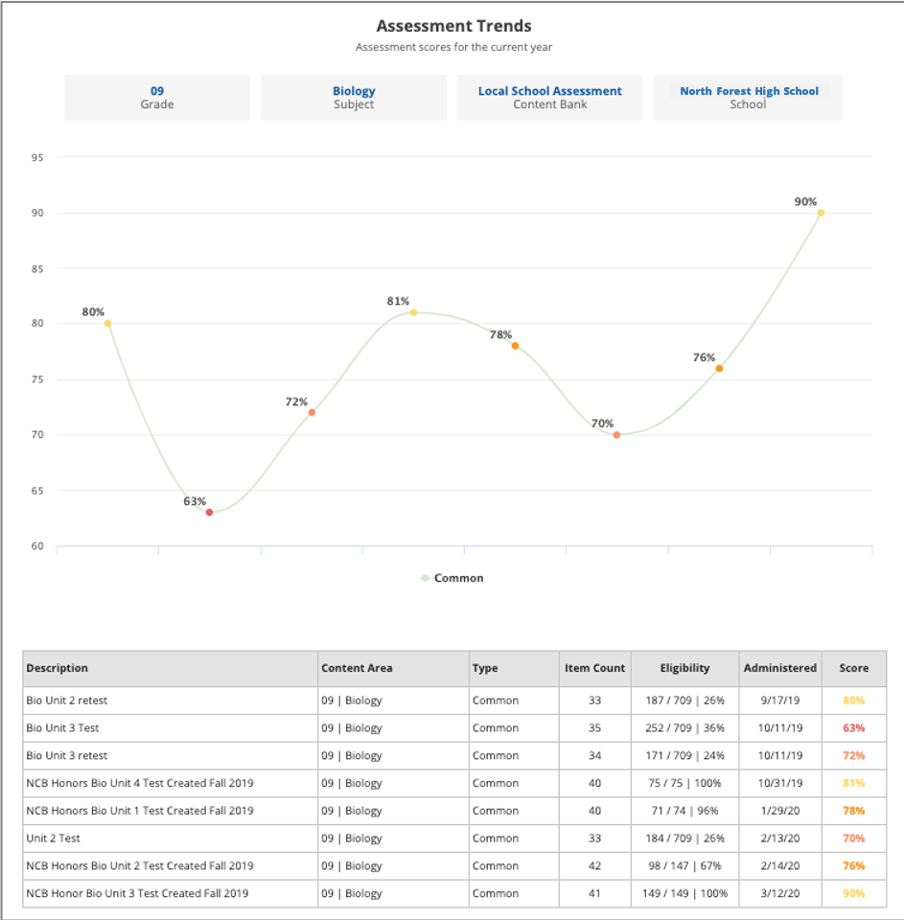
#2: Assessment Trends
The Assessment Trends report shows performance over time for a selected grade, content area and Assessment Bank. It includes a trending line chart and a detailed table of assessment performance. This report is excellent for identifying trends within subgroups such as grade or subject.
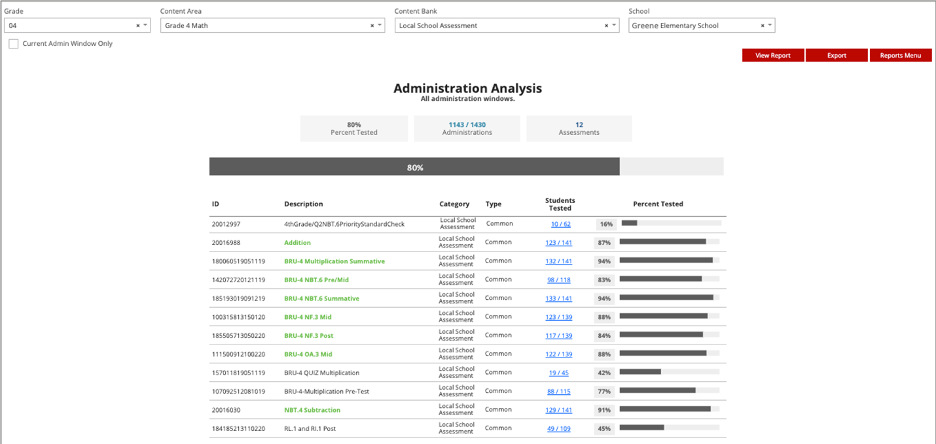
#3: Administration Analysis
Just as the name describes, the Administration Analysis reports shows testing coverage for a selected grade, content area and content bank. It provides a quick glance of how testing is progressing and a way of double checking that all students are being tested. Principals or other users can select a checkbox that allows them to toggle between active administration window or the entire school year.
#4: Usage Metrics
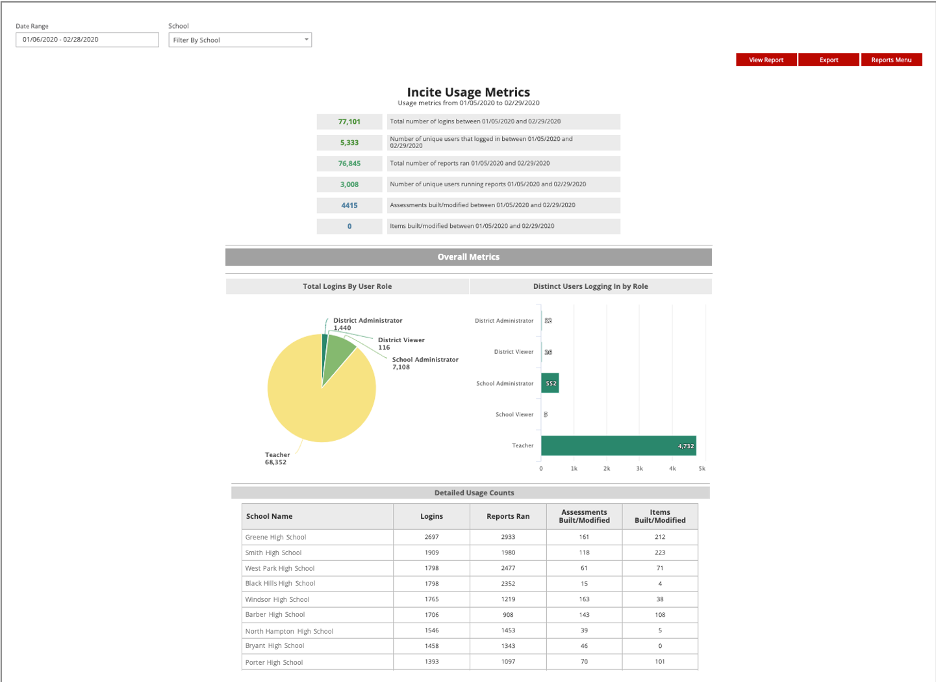
The Usage Metrics report lets principals see which teachers or educators are using the Incite platform and how. At the school level, they can see school and user-specific information such as total number of log-ins, number of reports run, and number of assessments and items built or modified. For principals, this information is helpful in assessing overall assessment patterns and habits within the school as well as determining if staff are maximizing the investment in the technology.
Principals—head over to our Facebook page and let us know what data points are most useful to you, and, if you are an EdIncites user, let us know your favorite report! In our next post in this series, we will shift to district-level administrators.


