
EdIncites was founded on the belief that data is a valuable tool that makes educators more effective. That’s why our solutions include actionable reports and powerful analytics that guide the instruction process and paint a picture of progress and proficiency through comparative and longitudinal data. This blog post is the first in a new series that will showcase how educators of all types can use EdIncites reports to differentiate instruction. Today, we are focusing on the top five EdIncites reports for teachers. Throughout the series, we will focus on which reports will be most beneficial for different roles including principals, superintendents, and assessment directors.
Before we begin, we want to make an important distinction—we offer both reports and analytics. Reports are based on static, pre-determined metrics. We have dozens of pre-built reports that users can access through our platform. Analytics are different in that they allow users to manipulate and assemble data. Analytics provide a way for users to ask questions of the data—they can filter and group as needed, export data into CSVs and even see how students are progressing in real-time. This series will focus on reports, but we plan to develop a series around analytics as well.
With all that out of the way, let’s get started! Teachers are the frontlines of education, working day in and day out directly with students. When it comes to data, they need to know things like, “how did my class do on that test,” “how did Student x do on that test,” “how well do my students understand this standard,” and so on. Our reports for teachers are designed to help teachers answer these questions so they can focus on delivering excellent, individualized instruction. Candice Coombs-Davies, an elementary teacher with Cobb County School District and EdIncites user said it best when she said, “I don’t have to go home and take a backpack full of tests to grade, but, rather, I can look at the reports and know what I need to do in the classroom.” We have dozens of reports that teachers find valuable, but the five most useful ones are:
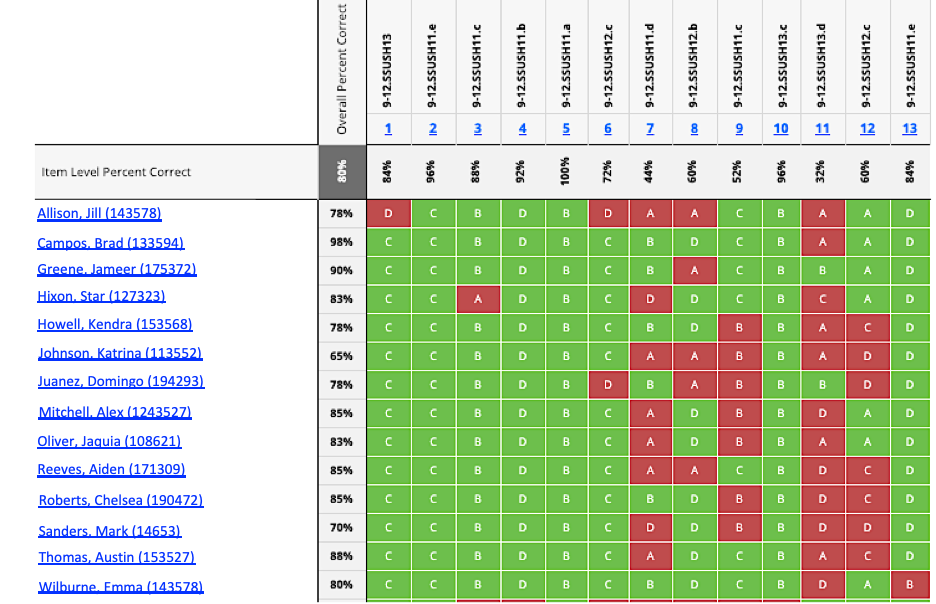
# 1: Distractor Analysis
The Distractor Analysis report shows a student’s response to every item on an assessment, color-coded based on if they answered correctly or incorrectly. It also shows the distribution of distractors and explanation of why incorrect answers may be chosen if distractor rationale is available. This is a great report for teachers to be able to identify patterns in answer selections, determine item validity and understand distraction responses.
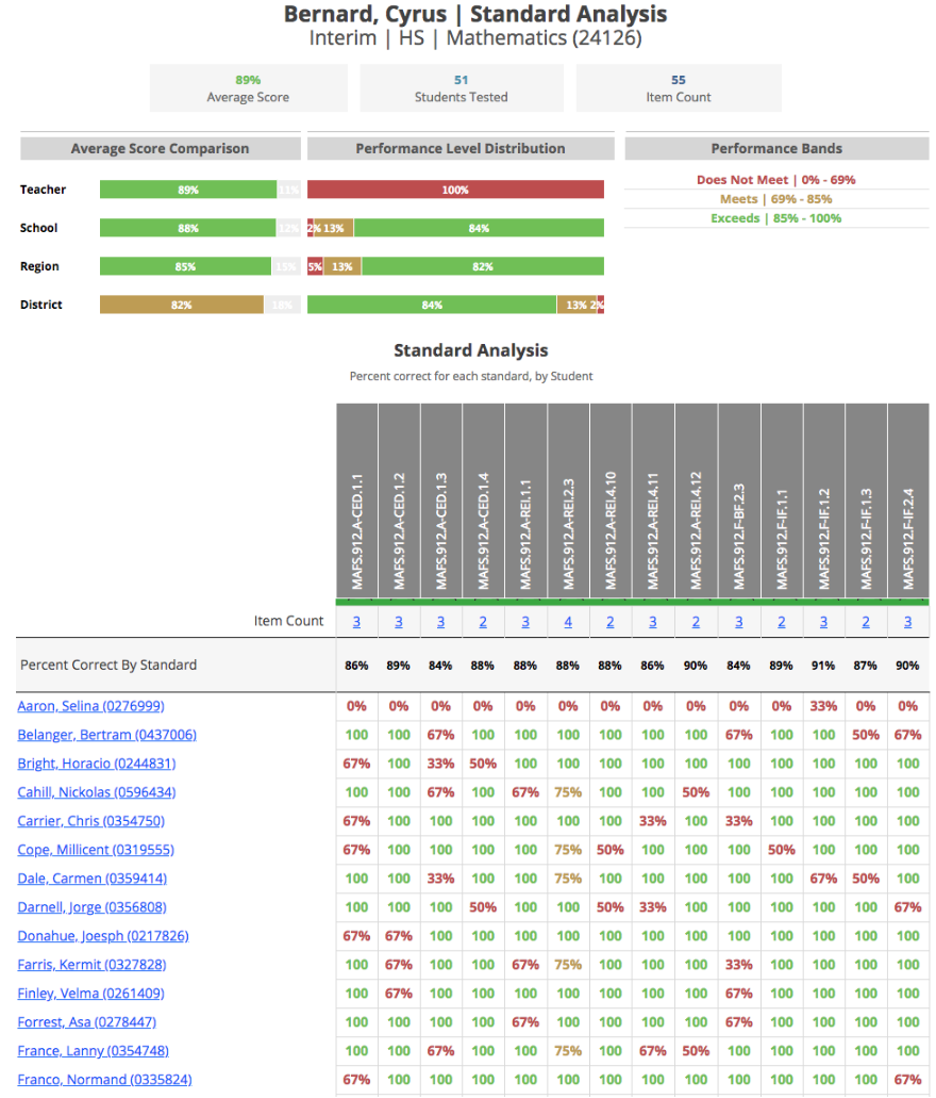
#2: Standard Analysis
The Standard Analysis report is a great tool that allows teachers to gain insight on how their students are mastering a particular standard. It displays each standard included on an assessment and includes the count of items aligned to each standard. It also shows how each standard performed for each student. As seen below, the Standard Analysis report allows teachers to easily see how each student is performing against particular standards.
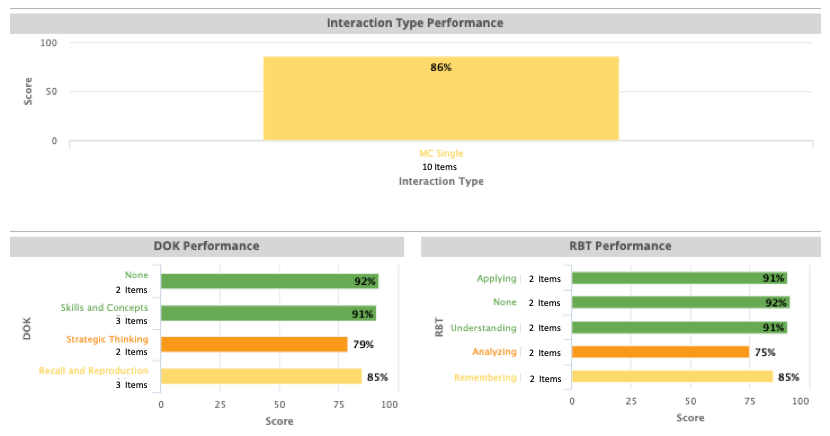
#3: Item Analysis
The Item Analysis report is a single assessment report that provides both a detailed look into each individual item on the assessment and a performance break-down by interaction type, DOK and RBT. Teachers can drill down to get a detailed look at performance on the individual item selected, including distractor distribution, rubric point distribution, item preview, standard text and all tagged metadata for the item. This is a great item-level report that lets teachers understand how students do on specific items.

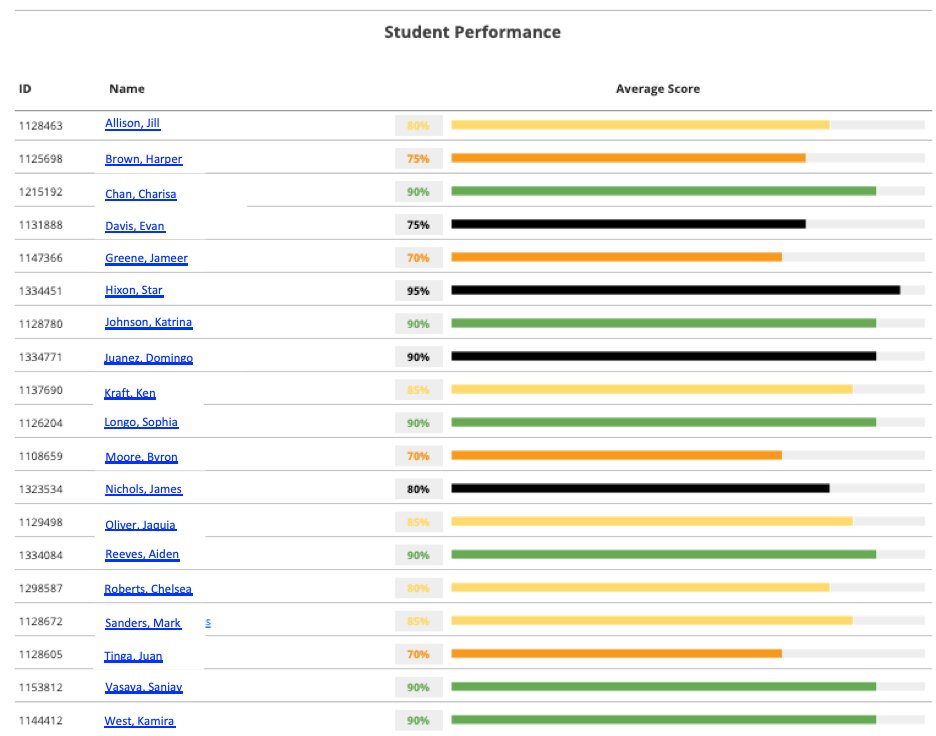
#4: Assessment Summary
The Assessment Summary report provides a high-level overview of performance on multiple aspects of a selected assessment, such as how a student performed on a standard or item, how long they spent on the test, and other overall performance metrics. For teachers, this is an excellent report to determine how students are doing compared to the other students in the class. As shown in the screenshots below, this report provides a range of information, available via drill-downs, such as standard performance, item performance and interaction performance.

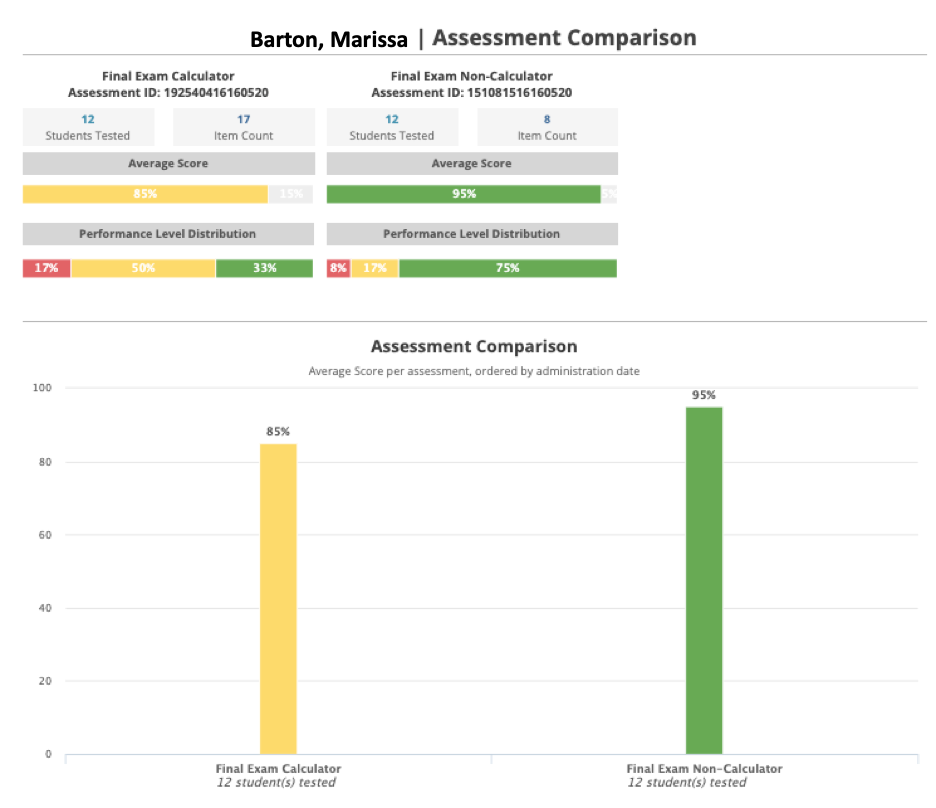
#5: Assessment Comparison
Unlike the other four reports we’ve featured in this post, the Assessment Comparison report allows teachers to select multiple assessments and compare scores across students. This capability allows teachers to visualize growth or trends across assessments side-by-side. The Assessment Comparison report is full of drill-down capabilities. For example, from the screen shown below, teachers can drill down to a detailed breakdown view (pictured below the first screenshot), which includes a list of students, average scores and assessment specific scores.
So, there you have it! These are our top 5 reports for teachers. We understand the value of data for all educators, which is why we’ve created these reports. If you are currently an EdIncites user, let us know your favorite report. And if not, let us know which one you think would be most useful in your classroom. Next up in this series will be our top reports for principals. Stay tuned!