The end of the academic year is an exciting and busy time. While it’s easy to get swept away in the celebrations of success from the past year, it’s also important to take a moment to pause and assess the data during this time. At EdIncites, we encourage a data-centered approach to teaching and learning all year long. The end of the school year is an important time to uncover powerful data that can be used to improve learning outcomes for all student populations. Today we are sharing four ways that educators–ranging from classroom teachers to district superintendents–can make the most of data at this critical time of the year.
Preparing Students for End-of-Year Testing
You’ve spent the entire year preparing students for end-of-year testing. Chances are, you have a good grasp on which standards and concepts they are prepared for, but an often-overlooked facet of test prep is item type. Is a student really struggling with a concept or are they struggling with showing mastery of that concept through a particular item type? Perhaps they can answer a multiple choice question about the standard correctly but struggle with a constructed response item on the same standard. Having access to this sort of data will ensure that students are well equipped for end-of-year testing.
→ A helpful EdIncites report for preparing students for end-of-year testing: Student Current Year Summary Report
The Student Current Year Summary Report provides a comprehensive look at each student’s assessment history for the school year including a detailed analysis of the student’s performance by subject, standards, item type and DOK/RBT. Not only will this report show you which standards and concepts a student does or doesn’t perform well on, but it will also help you identify item types with which they may be struggling.
Evaluating Testing Patterns and Practices
Evaluating testing patterns and practices from staff will tell you a lot about the academic year. Some key data points to assess include:
- How many assessments were given? How often were they given?
- What type of assessments were given?
- What did testing windows and cycles look like? Were they appropriate?
- Did performance improve through subsequent testing?
One trend we noticed in the 2020-2021 academic year is that educators really embraced informal classroom testing more than ever before, likely in order to sustain engagement and gauge progress during the remote learning that happened because of COVID-19.
→ A helpful EdIncites report for identifying professional development needs for staff: Assessment Trends
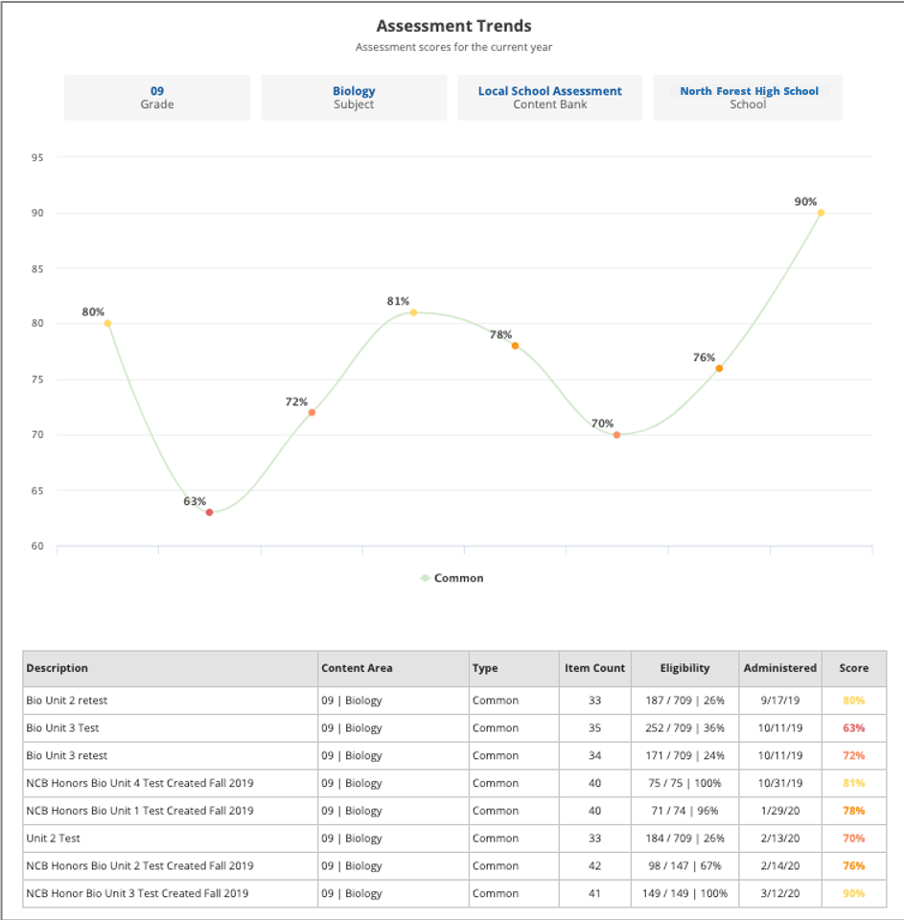
The Assessment Trends report shows performance over time for a selected grade, content area and assessment bank. It includes a trending line chart and a detailed table including information on item count, coverage, last date administered and overall scores. This report is especially useful for assessing performance changes throughout testing windows.
Identifying Professional Development Needs for Staff
It’s not a novel concept that assessment data will give some insight as to which teachers are being most effective in the classroom. Overall assessment data will help administrators identify educators who may need support in that area. Additionally, we encourage administrators to evaluate platform usage metrics to identify staff members who have not logged in, ran reports or created items and assessments, or may have only done so sparingly. These team members could likely benefit from professional development on how to use the platform in the classroom.
→ A helpful EdIncites report for identifying professional development needs for staff: Usage Metrics
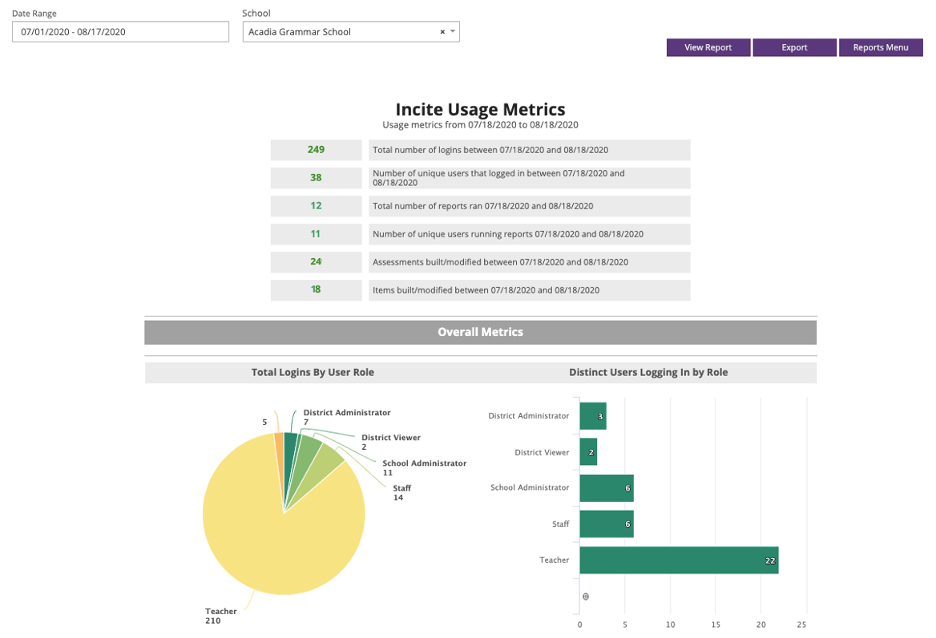
The Usage Metrics Report gives district and school level administrators insight into which schools and users are using the platform and how. Users can select a date range and view the following data for that time period: number of logins, number of reports ran, number of assessments created and number of items created. You can then drill down to see who the users are that are using (or not using) the platform.
Assessing Student Growth
Perhaps one of the most obvious (and gratifying) data points to assess at the end of the year is student achievement. In order to appropriately measure student growth over time, it is imperative to implement a comprehensive assessment cycle that tests student knowledge prior to and after instruction on specific concepts.
→ A helpful EdIncites report for assessing student growth: Assessment Comparison
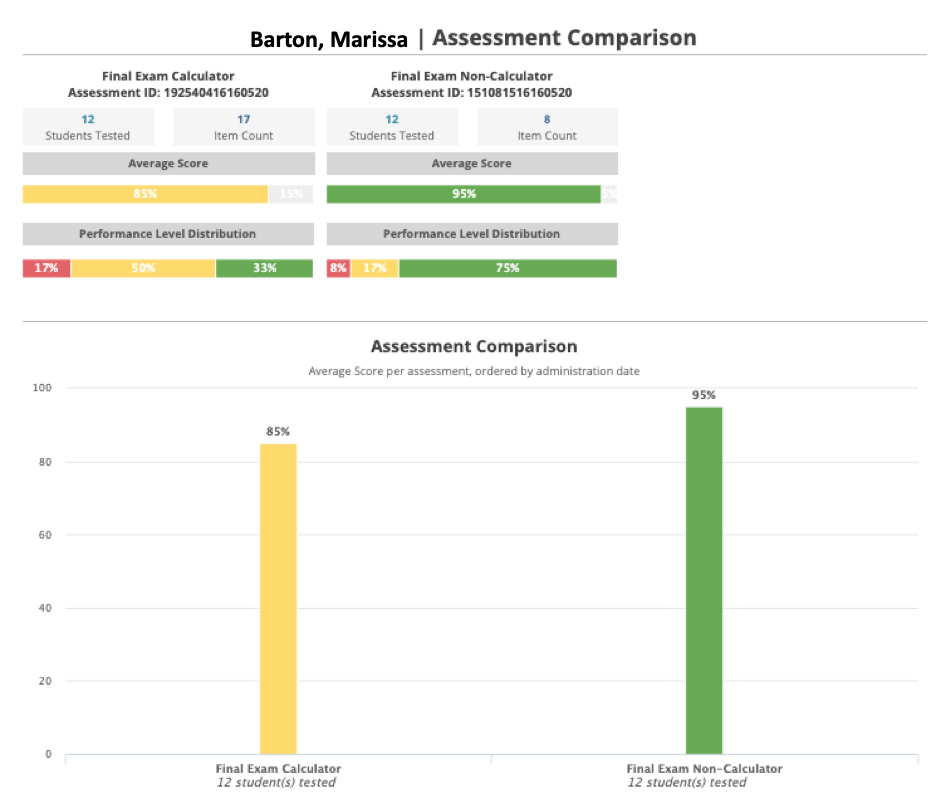
The Assessment Comparison Report is a multi-assessment report that allows the user to select more than one assessment and compare scores across schools, teachers or students depending on the reporting level. It includes the trending standard performance for the selected assessments so that you can easily see how students are growing over time relative to specific standards.
Tying It All Together with Incite Analytics
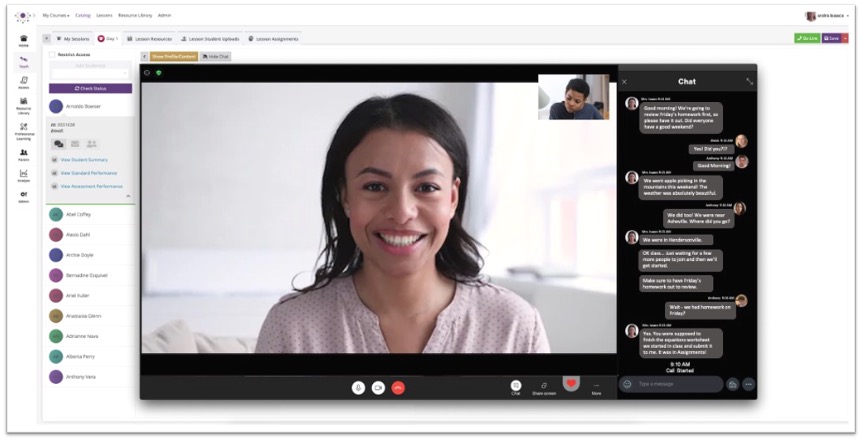
In addition to the dozens of reports we offer in our platform, Incite Analytics is a powerful data engine that allows users to easily select and compare multiple assessments and sort, group and filter data to view the data from various perspectives, all from a single page. Incite Analytics is especially useful at year-end as educators naturally want to assess progress over the last year and set priorities for the coming year. For end-of-year purposes, Incite Analytics can be used to compare assessments such as pre- and post-tests, all tests administered in a course or to show standard performance for the entire year. The screenshot below shows how Incite Analytics can be used to assess how well different schools within a district performed on a standard throughout the year. As you can see in the dropdown, this data can also be viewed at the teacher, student, grade, content area, region or demographic level.

At EdIncites, we are unapologetic about our passion for data. In fact, part of our mission is to make it a cultural centerpiece of education. Ultimately, evaluating and using data at year-end is intended to set your students and staff up for success in the following year. If you’re interested in learning how you or your district can better incorporate data into the classroom, get in touch.